Top 5 Metrics Every Walmart Seller Should Track for Maximum Profit
Jun 04, 2025
Whether you’re a seasoned Walmart Marketplace seller or just starting out, understanding which metrics truly matter can be the difference between a thriving business and one that just survives. At WalyMetrics, we help Walmart sellers uncover what’s driving their profits—and what’s silently eroding them.
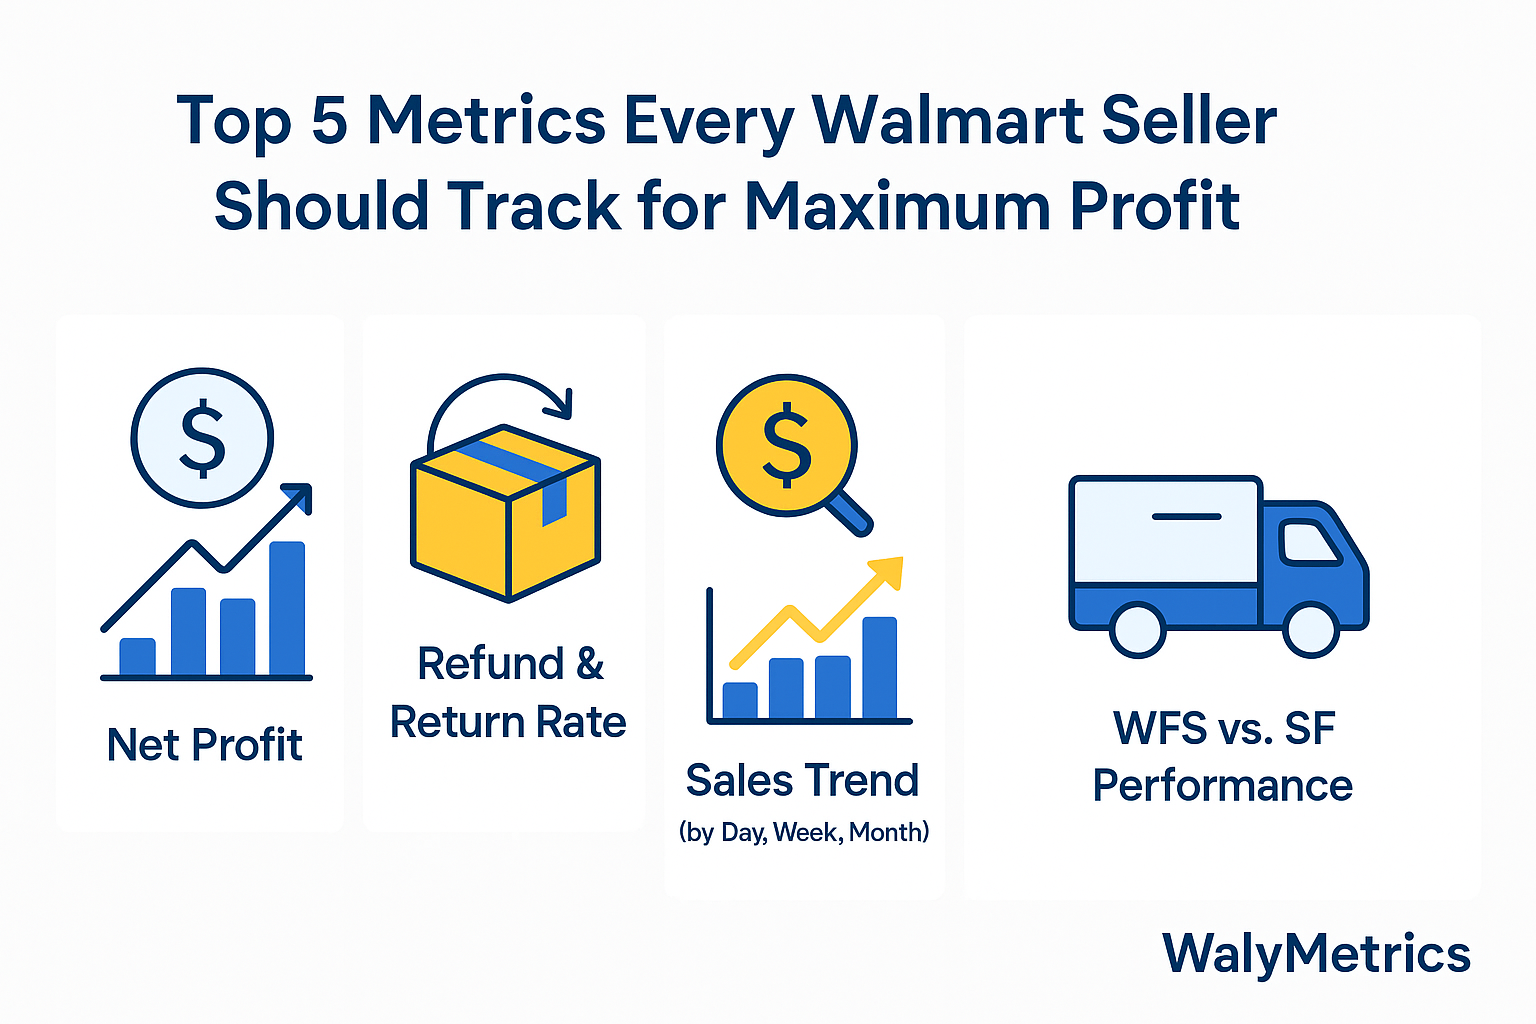
Let’s break down the top 5 metrics every seller should track to grow smarter, not just bigger.
🧮 1. Net Profit
Why it matters: Revenue is vanity—profit is reality.
Your net profit gives you the actual money you're making after subtracting all costs, including product cost, shipping (for SF orders), WFS fees, referral fees, and refunds.
How WalyMetrics helps:
We automatically calculate net profit per product and per order, factoring in all associated Walmart fees. For SF orders, you can even enter your shipping cost, and we do the rest.
✅ Pro Tip: Track your net profit weekly to spot dips before they hurt your bottom line.
📦 2. Refund & Return Rate
Why it matters: High returns = red flag.
Returns cut directly into your profit, especially if they’re frequent or due to recurring issues like “Item Not as Described.”
How WalyMetrics helps:
Our Returns Dashboard shows your return reasons, statuses, and dollar impact—allowing you to identify patterns and take action (like updating images, descriptions, or product sourcing).
✅ Pro Tip: Monitor return reasons monthly to reduce repeat issues and protect your seller score.
💸 3. ROI (Return on Investment)
Why it matters: ROI helps you prioritize your best-performing products.
Knowing how much you make per dollar spent is crucial for inventory decisions and scaling your store.
How WalyMetrics helps:
We auto-calculate ROI per product using your inputted cost and Walmart’s fee breakdowns. This is especially useful when comparing similar products or deciding which listings to restock.
✅ Pro Tip: Set a minimum ROI target (e.g., 30%) and discontinue low performers.
📈 4. Sales Trend (by Day, Week, Month)
Why it matters: Data over time reveals opportunities.
Tracking your sales trend helps identify seasonal peaks, product lifecycles, and demand drops.
How WalyMetrics helps:
Use our interactive sales charts to visualize how your units sold, revenue, and profit evolve over time. Drill down by product or fulfillment type (WFS vs SF).
✅ Pro Tip: Compare this month’s sales to last quarter to spot winning or slipping items.
🏷️ 5. WFS vs. SF Performance
Why it matters: Fulfillment method affects fees, speed, and customer satisfaction.
You need to know whether WFS (Walmart Fulfillment Services) or SF (Seller Fulfilled) is more profitable for each SKU.
How WalyMetrics helps:
We break down inventory, orders, fees, and profits by fulfillment type. You can instantly see which channel performs best—and optimize accordingly.
✅ Pro Tip: Consider moving high-volume items to WFS for better Buy Box placement and customer trust.
Final Thoughts
Selling on Walmart can be incredibly rewarding, but only if you track the right metrics. With WalyMetrics, you get clarity, confidence, and control—all in one dashboard.
Whether you want to optimize a single product or scale your entire store, start by focusing on net profit, ROI, and sales trends. Then refine based on return rates and fulfillment performance.
Want the full picture?
Log in to see your complete metrics, profit breakdowns, and more – all in one dashboard.
Start your free trial of Walymetrics